Global connection: The Geography of Board Game Ratings
Board games are a global phenomenon, with players and publishers from all over the world. See where in the world people are rating on BGG.
About the dataset
The used dataset is based on ratings that were submitted for games on BoardGameGeek before June 16, 2026.
It includes all ratings given to games with at least 2,000 ratings.
This criterion was met by 2,514 games (excluding expansions).
A total of 22,385,381 ratings were collected for these games, resulting in an average rating of 7.11.
The reason for introducing the minimum rating number restriction is to reduce potential bias,
but also to increase statistical relevance and focus on well-established titles with a large number of users.
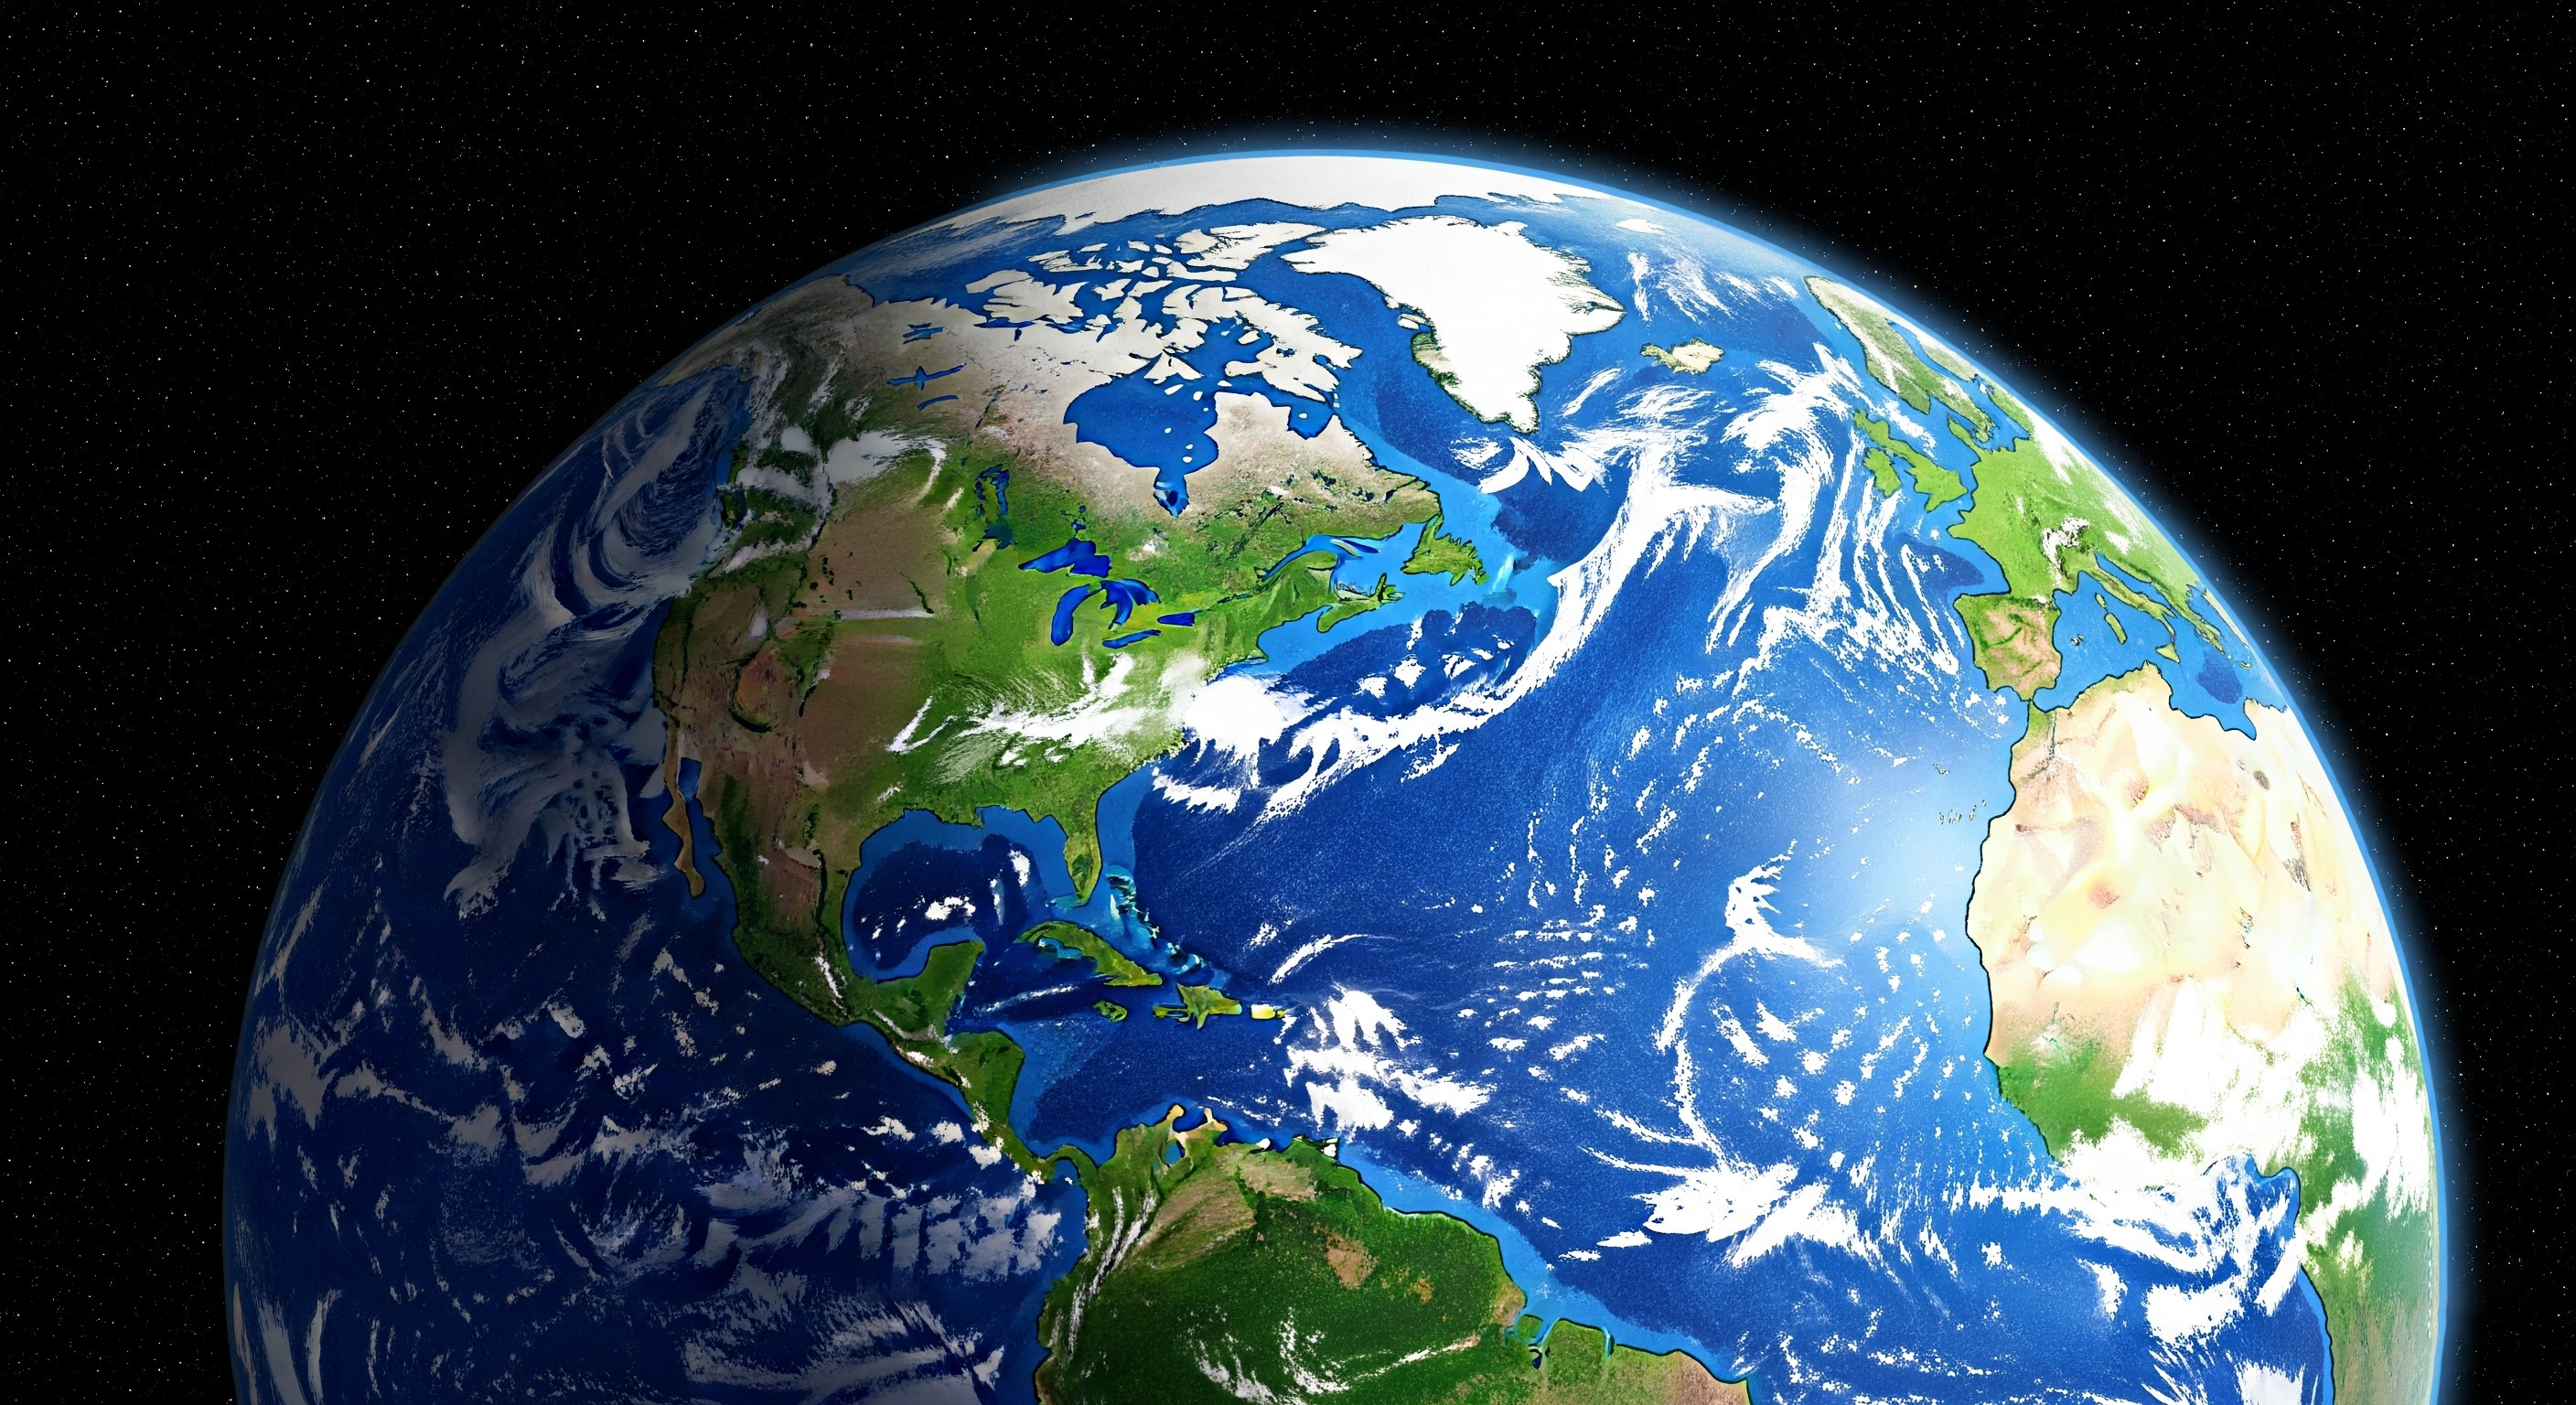
Board Games as a Global Phenomenon
Board games have fascinated people across the globe for thousands of years. From the ancient royal game of Ur in Mesopotamia, to chess in India, Go in China, Senet in Egypt, and countless traditional games found on every continent, playing together has always been an essential part of human culture. Regardless of era or geography, board games offer the opportunity to connect, compete, and share memorable experiences—transcending language, borders, and generations. In modern times, the hobby has flourished into a worldwide phenomenon, with passionate communities in North and South America, Europe, Asia, Oceania, and even enthusiasts in Africa and Antarctica. Today’s digital platforms like BoardGameGeek make it easier than ever for people from all continents to share their enthusiasm, rate their favorite games, and discover new ones.
Continental Rating Statistics
The global nature of board games is clearly reflected in the geographic distribution of game ratings submitted on BoardGameGeek.
An analysis of the dataset shows that users from almost every part of the world are actively contributing their opinions,
painting a diverse and fascinating picture of the modern board gaming landscape.
Table 1 shows the breakdown of all ratings by continent.
Most ratings come from Europe and the Americas, which together account for
71.37% of all submitted ratings.
This dominance highlights the particularly strong board gaming cultures and highly engaged communities in these regions.
When only ratings with a known origin are considered, the influence of Europe and America becomes even more pronounced,
making up over 91.96%
of all ratings with an assigned continent.
The third largest group of reviews was submitted without any geographical information.
22.39% of reviews cannot therefore be assigned to a specific location.
However, it can be assumed that the distribution of these reviews is similar to the known geographical distribution.
Although Asia has by far the largest population of any continent, reviews from Asia account for only a very small proportion of the reviews on BoardGameGeek.
Only 3.81% of all reviews come from Asia.
In contrast, Oceania has only a fraction of the population of Asia, but accounts for a similar proportion of reviews.
Only a very small percentage of all reviews come from Africa, the continent with the second largest population – namely only 0.15%.
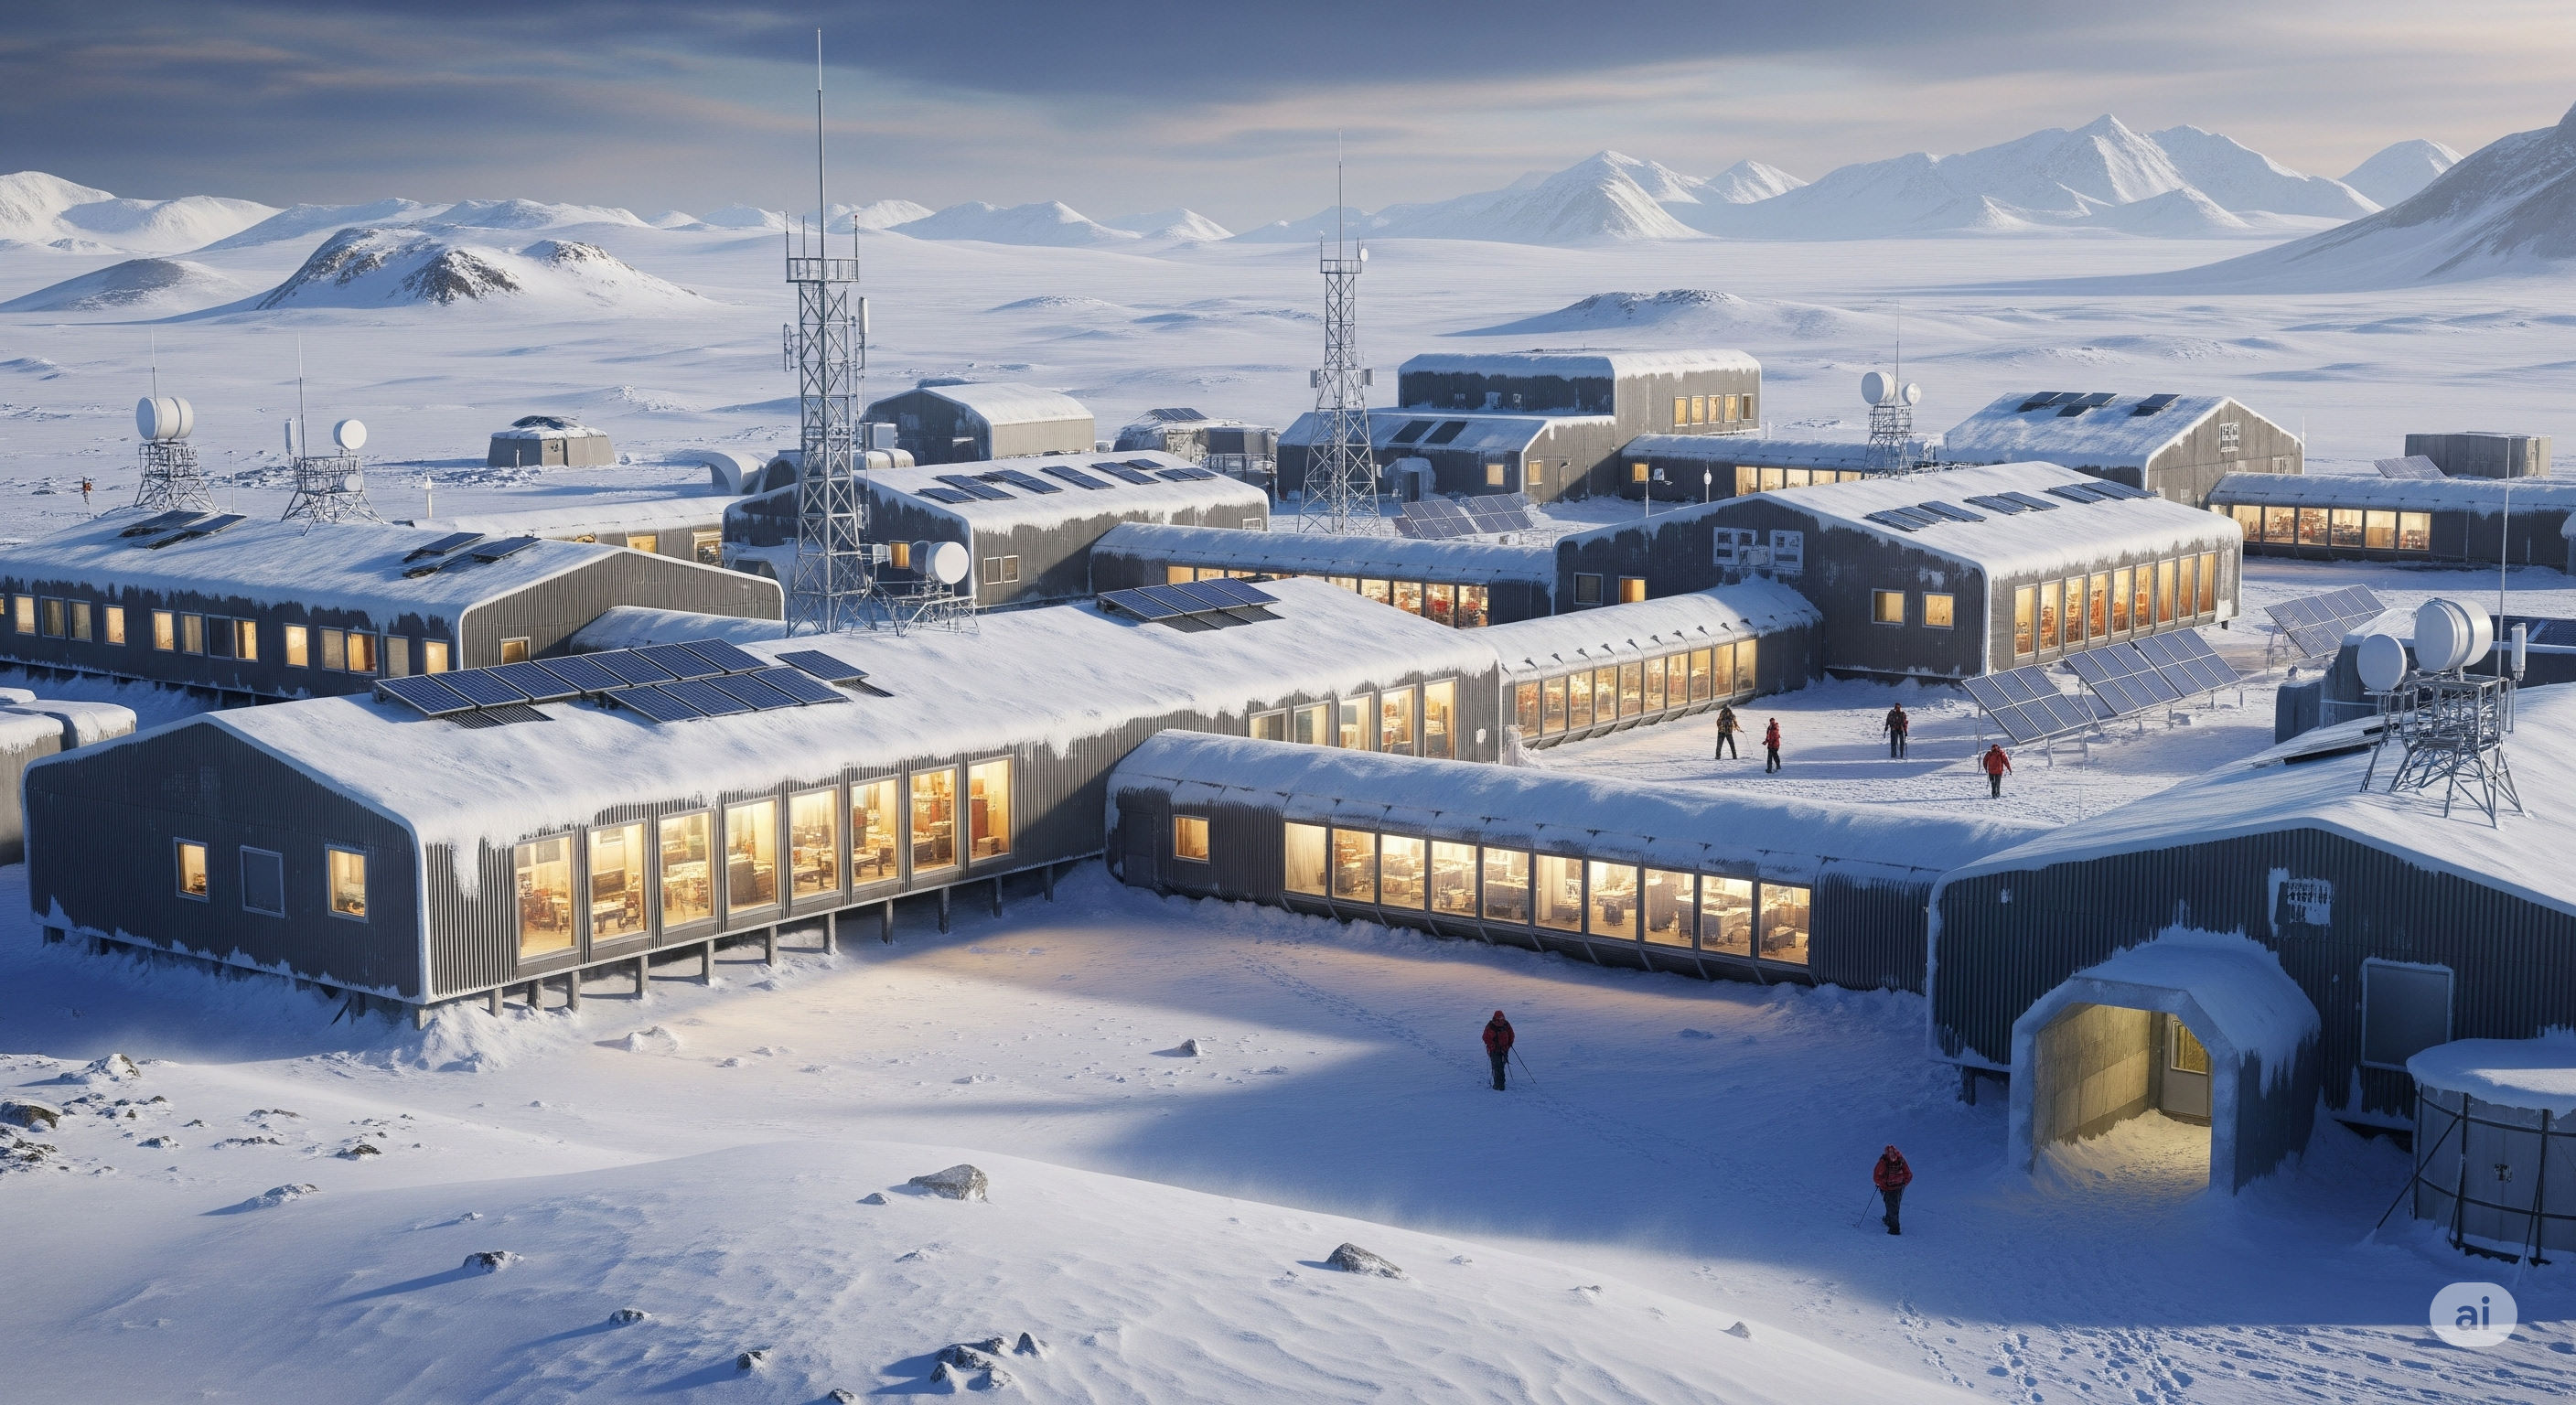
This makes it all the more remarkable that there are reviews from Antarctica.
As a continent with no permanent population, but only people living in over 80 research stations, 455 reviews of board games have been submitted.
For those spending long, dark winters at the ends of the earth, board games provide a valuable and entertaining way to pass the time and perhaps reduce the ever-growing "pile of shame."
Breakdown of board game ratings by continent.
| Continent | Total Ratings | Percentage of Ratings | Percentage of Ratings (excl. Unknown) |
|---|---|---|---|
| America | 8,330,738 | 37.1% | 47.8% |
| Europe | 7,703,988 | 34.3% | 44.2% |
| 🌍 Unknown | 5,030,732 | 22.4% | — |
| Asia | 856,269 | 3.8% | 4.9% |
| Oceania | 510,945 | 2.3% | 2.9% |
| Africa | 34,292 | 0.2% | 0.2% |
| Antarctica | 455 | 0.0% | 0.0% |
Board Game Ratings by Country
Looking one level down from the continents, the focus shifts to the country level.
While the continental data gives a broad overview, the country-level data provides more granular insights.
The following world map (Figure 1) shows the distribution of board game ratings across
different countries.
Countries are colored on a logarithmic scale based on the number of ratings they have contributed to
BoardGameGeek, with darker colors representing higher numbers of ratings. The legend shows the ranges
of ratings for each color category.
On the world map, countries in North America and Europe in particular are shown as centres with high ratings. This corresponds to the continental data.
European countries show a high degree of uniformity and a consistently high number of ratings.
Asian countries are also relatively evenly represented, albeit on a significantly lower basis of ratings.
Other continents, such as America and Africa, on the other hand, show a large discrepancy between countries with many ratings and those that are virtually unrepresented.
Interactive world map showing BoardGameGeek ratings by country. Darker colors indicate more active gaming communities.
Legend (Number of Ratings)
The interactive tree map in Figure 2 provides even better insight into the distribution of ratings across a continent and the relative sizes of the countries.
Each continent is colour-coded and contains all countries on that continent.
Each rectangle within a continent represents a country. The larger the rectangle, the more ratings there are for that country.
The size of each rectangle in relation to the entire tree map is equivalent to the percentage of ratings for that country compared to all ratings.
Clicking on a country enlarges the corresponding continent and displays the countries of that continent in comparison.
This allows you to see the uniformity or clear differences between the individual states described above for each continent.
The treemap shows how strongly individual countries dominate the ratings for the continents of Africa, America and Oceania.
The USA is the country with the most ratings worldwide (28.83%)
and also has the majority of ratings in America (77.47%).
Australia dominates in Oceania with 80.87% of the ratings,
but globally they only account for 1.85%.
Africa is also dominated by one country in terms of ratings: South Africa.
South Africa accounts for 79.18% of all African ratings,
but only a negligible 0.12% of all global ratings.
Interactive treemap showing countries sized by ratings and colored by continent. Click on any continent to zoom in and explore individual countries in detail.
Continent Colors
Table 2 can be used to obtain an overview of the assessment figures for individual countries. It contains information on the assessments for each individual country.
Searchable and sortable table of all countries with BoardGameGeek ratings. Find specific countries or explore the complete global data.
Countries by Ratings
Below are all countries with board game ratings on BoardGameGeek. This data reflects the geographical distribution of the platform's user base. Use the search and sorting features to explore the data.
| Rank | Country | Continent | Total Ratings | Percentage |
|---|---|---|---|---|
| 1 | United States | America | 6,453,613 | 28.83% |
| 2 | 🌍 Unknown | Unknown | 5,028,728 | 22.46% |
| 3 | Germany | Europe | 1,289,784 | 5.76% |
| 4 | Canada | America | 1,255,385 | 5.61% |
| 5 | United Kingdom | Europe | 1,000,522 | 4.47% |
| 6 | Spain | Europe | 835,677 | 3.73% |
| 7 | Poland | Europe | 590,457 | 2.64% |
| 8 | Italy | Europe | 461,085 | 2.06% |
| 9 | France | Europe | 454,900 | 2.03% |
| 10 | Australia | Oceania | 413,206 | 1.85% |
| 11 | Netherlands | Europe | 410,068 | 1.83% |
| 12 | Belgium | Europe | 350,058 | 1.56% |
| 13 | Sweden | Europe | 309,028 | 1.38% |
| 14 | Brazil | America | 251,329 | 1.12% |
| 15 | Finland | Europe | 219,709 | 0.98% |
| 16 | Russia | Europe | 219,096 | 0.98% |
| 17 | Hungary | Europe | 183,507 | 0.82% |
| 18 | Denmark | Europe | 163,691 | 0.73% |
| 19 | Greece | Europe | 134,782 | 0.60% |
| 20 | Japan | Asia | 128,242 | 0.57% |
| 21 | South Korea | Asia | 121,637 | 0.54% |
| 22 | Portugal | Europe | 121,476 | 0.54% |
| 23 | Mexico | America | 118,305 | 0.53% |
| 24 | Switzerland | Europe | 107,368 | 0.48% |
| 25 | Austria | Europe | 104,275 | 0.47% |
| 26 | Norway | Europe | 97,228 | 0.43% |
| 27 | Czech Republic | Europe | 96,886 | 0.43% |
| 28 | New Zealand | Oceania | 94,488 | 0.42% |
| 29 | China | Asia | 93,978 | 0.42% |
| 30 | Taiwan | Asia | 83,872 | 0.37% |
| 31 | Argentina | America | 76,114 | 0.34% |
| 32 | Ukraine | Europe | 68,311 | 0.31% |
| 33 | Chile | America | 64,228 | 0.29% |
| 34 | Hong Kong | Asia | 60,606 | 0.27% |
| 35 | Singapore | Asia | 57,078 | 0.25% |
| 36 | Romania | Europe | 56,298 | 0.25% |
| 37 | England | Europe | 48,187 | 0.22% |
| 38 | Thailand | Asia | 43,688 | 0.20% |
| 39 | Ireland | Europe | 42,627 | 0.19% |
| 40 | Croatia | Europe | 39,916 | 0.18% |
| 41 | Israel | Asia | 36,323 | 0.16% |
| 42 | Colombia | America | 36,268 | 0.16% |
| 43 | Indonesia | Asia | 33,311 | 0.15% |
| 44 | Turkey | Asia | 31,085 | 0.14% |
| 45 | Scotland | Europe | 29,623 | 0.13% |
| 46 | Lithuania | Europe | 29,322 | 0.13% |
| 47 | Serbia | Europe | 28,869 | 0.13% |
| 48 | Malaysia | Asia | 28,662 | 0.13% |
| 49 | South Africa | Africa | 27,152 | 0.12% |
| 50 | Bulgaria | Europe | 27,122 | 0.12% |
| 51 | Latvia | Europe | 26,990 | 0.12% |
| 52 | Philippines | Asia | 26,099 | 0.12% |
| 53 | Estonia | Europe | 25,734 | 0.11% |
| 54 | Slovakia | Europe | 24,746 | 0.11% |
| 55 | India | Asia | 22,862 | 0.10% |
| 56 | Iran | Asia | 21,563 | 0.10% |
| 57 | Belarus | Europe | 19,701 | 0.09% |
| 58 | Iceland | Europe | 18,414 | 0.08% |
| 59 | Peru | America | 17,990 | 0.08% |
| 60 | Luxembourg | Europe | 14,671 | 0.07% |
| 61 | Vietnam | Asia | 14,240 | 0.06% |
| 62 | Slovenia | Europe | 13,872 | 0.06% |
| 63 | Costa Rica | America | 13,518 | 0.06% |
| 64 | Wales | Europe | 12,391 | 0.06% |
| 65 | Uruguay | America | 11,054 | 0.05% |
| 66 | United Arab Emirates | Asia | 10,830 | 0.05% |
| 67 | Saudi Arabia | Asia | 8,493 | 0.04% |
| 68 | Kazakhstan | Asia | 7,453 | 0.03% |
| 69 | Guatemala | America | 5,792 | 0.03% |
| 70 | Venezuela | America | 4,833 | 0.02% |
| 71 | Bolivia | America | 4,812 | 0.02% |
| 72 | Cyprus | Asia | 4,525 | 0.02% |
| 73 | The Netherlands | Europe | 4,458 | 0.02% |
| 74 | Andorra | Europe | 4,040 | 0.02% |
| 75 | Ecuador | America | 3,882 | 0.02% |
| 76 | Puerto Rico | America | 3,546 | 0.02% |
| 77 | Georgia | Asia | 3,276 | 0.01% |
| 78 | Moldova | Europe | 3,092 | 0.01% |
| 79 | Malta | Europe | 2,701 | 0.01% |
| 80 | Macedonia | Europe | 2,367 | 0.01% |
| 81 | Panama | America | 2,113 | 0.01% |
| 82 | Kuwait | Asia | 1,963 | 0.01% |
| 83 | Armenia | Asia | 1,877 | 0.01% |
| 84 | Bangladesh | Asia | 1,789 | 0.01% |
| 85 | Isle of Man | Europe | 1,590 | 0.01% |
| 86 | Egypt | Africa | 1,583 | 0.01% |
| 87 | Azerbaijan | Asia | 1,554 | 0.01% |
| 88 | Bosnia and Herzegovina | Europe | 1,381 | 0.01% |
| 89 | Czechia | Europe | 1,335 | 0.01% |
| 90 | Türkiye | Asia | 1,299 | 0.01% |
| 91 | El Salvador | America | 1,258 | 0.01% |
| 92 | Macao | Asia | 1,253 | 0.01% |
| 93 | Dominican Republic | America | 1,216 | 0.01% |
| 94 | Guernsey | Europe | 1,174 | 0.01% |
| 95 | Montenegro | Europe | 1,169 | 0.01% |
| 96 | Jersey | Europe | 1,095 | 0.00% |
| 97 | Qatar | Asia | 1,090 | 0.00% |
| 98 | Bahrain | Asia | 1,033 | 0.00% |
| 99 | Kyrgyzstan | Asia | 995 | 0.00% |
| 100 | Other-Eastern Europe | Unknown | 986 | 0.00% |
| 101 | Kenya | Africa | 940 | 0.00% |
| 102 | Paraguay | America | 893 | 0.00% |
| 103 | San Marino | Europe | 892 | 0.00% |
| 104 | Réunion | Africa | 886 | 0.00% |
| 105 | Åland | Europe | 885 | 0.00% |
| 106 | Lebanon | Asia | 795 | 0.00% |
| 107 | French Polynesia | Oceania | 719 | 0.00% |
| 108 | Jordan | Asia | 602 | 0.00% |
| 109 | Cayman Islands | America | 588 | 0.00% |
| 110 | Bermuda | America | 573 | 0.00% |
| 111 | American Samoa | Oceania | 546 | 0.00% |
| 112 | Pakistan | Asia | 531 | 0.00% |
| 113 | Brunei | Asia | 516 | 0.00% |
| 114 | Uzbekistan | Asia | 468 | 0.00% |
| 115 | New Caledonia | Oceania | 432 | 0.00% |
| 116 | Honduras | America | 430 | 0.00% |
| 117 | Sri Lanka | Asia | 400 | 0.00% |
| 118 | Tonga | Oceania | 388 | 0.00% |
| 119 | Abkhazia | Asia | 380 | 0.00% |
| 120 | Iraq | Asia | 373 | 0.00% |
| 121 | Myanmar [Burma] | Asia | 373 | 0.00% |
| 122 | Albania | Europe | 362 | 0.00% |
| 123 | U.S. Virgin Islands | America | 356 | 0.00% |
| 124 | Falkland Islands | America | 353 | 0.00% |
| 125 | Mongolia | Asia | 337 | 0.00% |
| 126 | APO/FPO | Unknown | 333 | 0.00% |
| 127 | Guam | Oceania | 323 | 0.00% |
| 128 | Ethiopia | Africa | 317 | 0.00% |
| 129 | Antarctica | Antarctica | 315 | 0.00% |
| 130 | Morocco | Africa | 301 | 0.00% |
| 131 | Jamaica | America | 296 | 0.00% |
| 132 | Mauritius | Africa | 291 | 0.00% |
| 133 | Faroe Islands | Europe | 284 | 0.00% |
| 134 | Cape Verde | Africa | 279 | 0.00% |
| 135 | Trinidad and Tobago | America | 271 | 0.00% |
| 136 | Gibraltar | Europe | 268 | 0.00% |
| 137 | Bahamas | America | 266 | 0.00% |
| 138 | Other-Asia | Unknown | 263 | 0.00% |
| 139 | Somalia | Africa | 262 | 0.00% |
| 140 | Pitcairn Islands | Oceania | 255 | 0.00% |
| 141 | Martinique | America | 235 | 0.00% |
| 142 | Tunisia | Africa | 220 | 0.00% |
| 143 | Grenada | America | 212 | 0.00% |
| 144 | Papua New Guinea | Oceania | 208 | 0.00% |
| 145 | Uganda | Africa | 203 | 0.00% |
| 146 | Monaco | Europe | 198 | 0.00% |
| 147 | Oman | Asia | 189 | 0.00% |
| 148 | Togo | Africa | 187 | 0.00% |
| 149 | Cuba | America | 180 | 0.00% |
| 150 | Adjara | Unknown | 173 | 0.00% |
| 151 | Algeria | Africa | 170 | 0.00% |
| 152 | French Guiana | America | 148 | 0.00% |
| 153 | Fiji | Oceania | 144 | 0.00% |
| 154 | Guadeloupe | America | 142 | 0.00% |
| 155 | Mali | Africa | 142 | 0.00% |
| 156 | South Georgia and the South Sandwich Islands | Antarctica | 139 | 0.00% |
| 157 | Other-South Pacific | Unknown | 132 | 0.00% |
| 158 | Palestine | Asia | 130 | 0.00% |
| 159 | Belize | America | 123 | 0.00% |
| 160 | Angola | Africa | 109 | 0.00% |
| 161 | Sudan | Africa | 106 | 0.00% |
| 162 | Cameroon | Africa | 105 | 0.00% |
| 163 | Saint Vincent and the Grenadines | America | 100 | 0.00% |
| 164 | Swaziland | Africa | 98 | 0.00% |
| 165 | Vatican City | Europe | 97 | 0.00% |
| 166 | North Korea | Asia | 97 | 0.00% |
| 167 | Cambodia | Asia | 97 | 0.00% |
| 168 | Madagascar | Africa | 95 | 0.00% |
| 169 | Greenland | America | 89 | 0.00% |
| 170 | Kosovo | Europe | 88 | 0.00% |
| 171 | Afghanistan | Asia | 82 | 0.00% |
| 172 | Tanzania | Africa | 79 | 0.00% |
| 173 | Zambia | Africa | 77 | 0.00% |
| 174 | Burkina Faso | Africa | 73 | 0.00% |
| 175 | Zimbabwe | Africa | 70 | 0.00% |
| 176 | Kiribati | Oceania | 63 | 0.00% |
| 177 | Mauritania | Africa | 62 | 0.00% |
| 178 | Liechtenstein | Europe | 61 | 0.00% |
| 179 | Malawi | Africa | 55 | 0.00% |
| 180 | São Tomé and Príncipe | Africa | 54 | 0.00% |
| 181 | Tristan da Cunha | Africa | 52 | 0.00% |
| 182 | U.S. Minor Outlying Islands | Oceania | 50 | 0.00% |
| 183 | Nigeria | Africa | 50 | 0.00% |
| 184 | Ghana | Africa | 47 | 0.00% |
| 185 | Marshall Islands | Oceania | 45 | 0.00% |
| 186 | Akrotiri and Dhekelia | Unknown | 43 | 0.00% |
| 187 | Laos | Asia | 42 | 0.00% |
| 188 | Tajikistan | Asia | 42 | 0.00% |
| 189 | Nicaragua | America | 40 | 0.00% |
| 190 | Netherlands Antilles | Unknown | 39 | 0.00% |
| 191 | Cocos [Keeling] Islands | Asia | 38 | 0.00% |
| 192 | Solomon Islands | Oceania | 38 | 0.00% |
| 193 | Saint Lucia | America | 36 | 0.00% |
| 194 | Syria | Asia | 36 | 0.00% |
| 195 | Namibia | Africa | 35 | 0.00% |
| 196 | Suriname | America | 34 | 0.00% |
| 197 | Nagorno-Karabakh | Unknown | 33 | 0.00% |
| 198 | Maldives | Asia | 31 | 0.00% |
| 199 | North Macedonia | Europe | 29 | 0.00% |
| 200 | Djibouti | Africa | 29 | 0.00% |
| 201 | Antigua and Barbuda | America | 27 | 0.00% |
| 202 | Curacao | Europe | 26 | 0.00% |
| 203 | Saint Barthélemy | America | 25 | 0.00% |
| 204 | Chad | Africa | 25 | 0.00% |
| 205 | Wallis and Futuna | Oceania | 23 | 0.00% |
| 206 | Mozambique | Africa | 23 | 0.00% |
| 207 | Barbados | America | 22 | 0.00% |
| 208 | DR Congo | Africa | 18 | 0.00% |
| 209 | Samoa | Oceania | 17 | 0.00% |
| 210 | Christmas Island | Asia | 16 | 0.00% |
| 211 | Seychelles | Africa | 16 | 0.00% |
| 212 | Gabon | Africa | 15 | 0.00% |
| 213 | Sierra Leone | Africa | 14 | 0.00% |
| 214 | Senegal | Africa | 13 | 0.00% |
| 215 | Guyana | America | 10 | 0.00% |
| 216 | Aruba | America | 9 | 0.00% |
| 217 | Nepal | Asia | 8 | 0.00% |
| 218 | Libya | Africa | 8 | 0.00% |
| 219 | Rwanda | Africa | 7 | 0.00% |
| 220 | Botswana | Africa | 7 | 0.00% |
| 221 | Anguilla | America | 6 | 0.00% |
| 222 | Bonaire | America | 6 | 0.00% |
| 223 | Haiti | America | 6 | 0.00% |
| 224 | East Timor | Asia | 6 | 0.00% |
| 225 | Svalbard and Jan Mayen | Europe | 5 | 0.00% |
| 226 | Democratic Republic of the Congo | Africa | 5 | 0.00% |
| 227 | Gambia | Africa | 3 | 0.00% |
| 228 | South Sudan | Africa | 3 | 0.00% |
| 229 | Burundi | Africa | 3 | 0.00% |
| 230 | Turkmenistan | Asia | 2 | 0.00% |
| 231 | Saint Pierre and Miquelon | America | 2 | 0.00% |
| 232 | Ascension Island | Unknown | 2 | 0.00% |
| 233 | Saint Kitts and Nevis | America | 2 | 0.00% |
| 234 | Bhutan | Asia | 1 | 0.00% |
| 235 | Dominica | America | 1 | 0.00% |
| 236 | Bouvet Island | Antarctica | 1 | 0.00% |
| 237 | Guinea | Africa | 1 | 0.00% |
| 238 | Turks and Caicos Islands | America | 1 | 0.00% |
| 239 | Republic of the Congo | Africa | 1 | 0.00% |
| 240 | Niger | Africa | 1 | 0.00% |
| 241 | Yemen | Asia | 1 | 0.00% |